Just for a lark, I decided to plot the data on semi-logarithmic graph paper. My thinking process revolved around the idea of what a banker would do to forecast for the future mortgage delinquency's and this looked like a pretty good start. If you're a banker, this has to be a graph that is hopefully flawed! If not, there is going to be some pain.
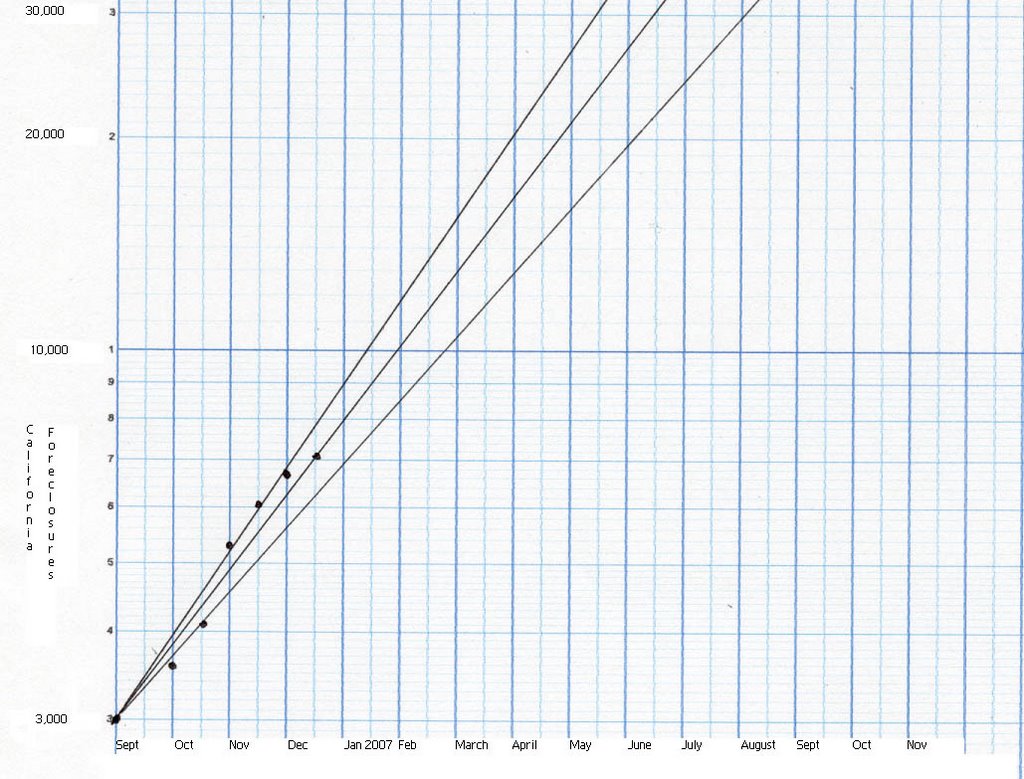
This graph plots the increasing foreclosures in the California market and the predicted future foreclosures. Three lines are drawn High, Middle and Low estimates based on data supplied. Double click on the graph for an enlarged view.
A few interesting notes. The total foreclosures for 7/29 was 3,384 (a data point I didn't use) and the figure for 9/1 was 3,060. 324 foreclosures disappeared. What we could be looking at here, are Notices of Default (NOD) being filed and as in say a bankruptcy, the bank accepts the deed in lieu of foreclosure. Bankruptcies do not necessarily generate a NOD but the banks acceptance of the property would probably cure the NOD.
What we cannot see in real time that the banker can, is how many people he has on their way to a NOD that he is aware of. We don't see the figures until the NOD is filed. If it's a bankruptcy, there just might not be a NOD.
So, back to the visual aid here, if you look at the middle of next June, we could be looking at about 23,000 foreclosures. This years total will probably be less than 8,000, but if we "trust" the graph, we are going to be in pain in June of next year.
The real issue here is, if the data assumptions are correct for June of 2007, this implies a banking crisis far greater than the Savings & Loan debacle of the 1990's.
7 comments:
I agree about your point about NODs, but I am just not sure that the graph should be logarithmic. It isn't growth of a value that we are looking at, but just a total number of foreclosures.
It's like looking at the stock market and graphing the total number of shares transacted. It doesn't need to be logarithmic, but the value of the stocks can be graphed logarithmically as it will grow exponentially.
Your graph looks to be actually rather linear so far. Older data points would help establish this better.
I am dying to know if anyone has any concept of the number of NODs.
The graph would have a definite curve in it if plotted on regular graph paper. The projection for June on semi logarithmic paper suggest that its going ballistic.
I agree with you in principle that foreclosures are going on increase but I don't agree with your graph.
A linear line on a logarithmic scale would translate into exponential (base e or 10 depending on what you used in the log scale) curve on a regular graph.
No science does extrapolation on a log scale.
But no denying the fact that foreclosures are going to increase. Even if you take in to consideration a linear increase that's going to bring down the economy big time.
Dear Anon,
Maybe we are just splitting hairs here.
What I was trying to illustrated using semi logarithmic paper, was the fact that the number of NODs is increasing geometrically. If you plot the function y=(x)squared, you get a straight line.
The geometric implication is that we have lost control. You more or less have a giant snowball rolling down hill.
An arithmetic progression would suggest that the situation could be controlled, this one looks as if it is self feeding.
Plot the 7,914 foreclosures total posted for today (Jan 5) and it falls almost on the middle line.
This is not a good thing, I classify it as eerie and unsettling.
I hope this clarifies what I was trying to illustrate
Jim--awesome! I had the same thought about tracking their numbers, since they nicely total it out. Any idea at what point they drop a property out of their count? Just for this week, the national #'s increased about 1 1/2% for both preforeclosure and foreclosure. Kinda gives you that sick feeling in the pit of your stomach, eh?
Hi Asuwest,
I thought that they would start over with the new year, but that didn't happen. I am guessing that these numbers are "real time" numbers, the old drops off and the new is added. I could be wrong on this.
Just noticed another site Realtytrec.com that lists REO's. Its showing 3,431 REO's for San Diego. I guess this isn't something you want to get on a soap box and start yelling about, people would probably think you had lost it, in Never Never Land!
not old enough to have a recollection of 1990 effect you mentioned, what was that all about?
Post a Comment