Just for a lark, I decided to plot the data on semi-logarithmic graph paper. My thinking process revolved around the idea of what a banker would do to forecast for the future mortgage delinquency's and this looked like a pretty good start. If you're a banker, this has to be a graph that is hopefully flawed! If not, there is going to be some pain.
This graph plots the increasing foreclosures in the California market and the predicted future foreclosures. Three lines are drawn High, Middle and Low estimates based on data supplied. Double click on the graph for an enlarged view.
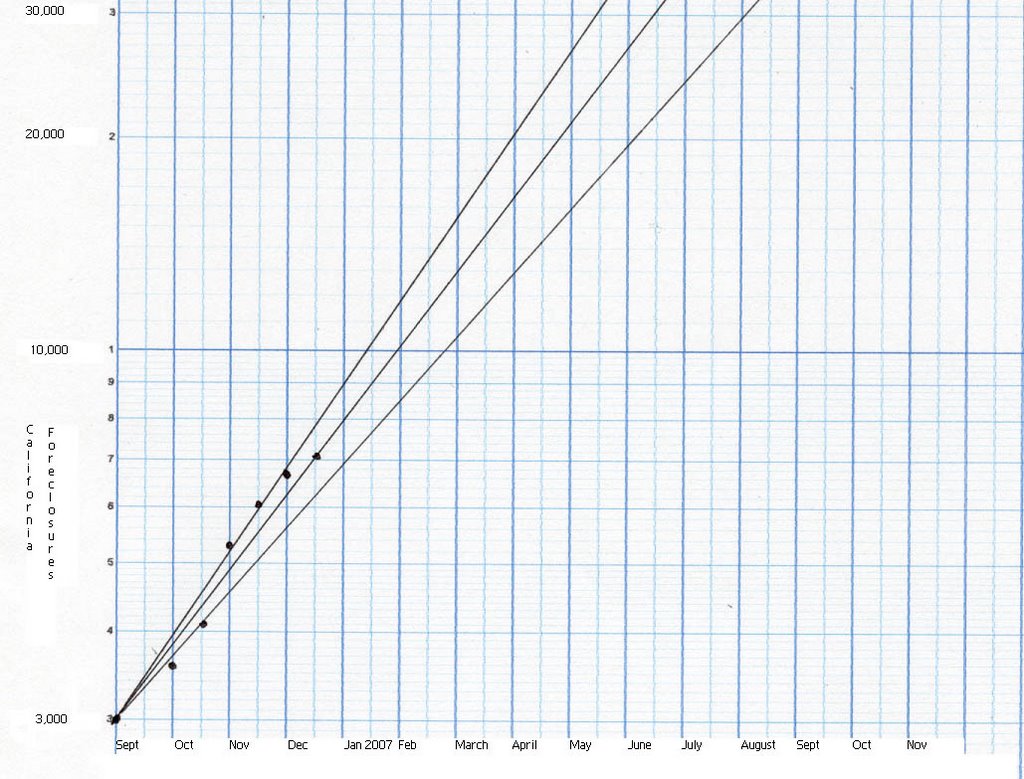
A few interesting notes. The total foreclosures for 7/29 was 3,384 (a data point I didn't use) and the figure for 9/1 was 3,060. 324 foreclosures disappeared. What we could be looking at here, are Notices of Default (NOD) being filed and as in say a bankruptcy, the bank accepts the deed in lieu of foreclosure. Bankruptcies do not necessarily generate a NOD but the banks acceptance of the property would probably cure the NOD.
What we cannot see in real time that the banker can, is how many people he has on their way to a NOD that he is aware of. We don't see the figures until the NOD is filed. If it's a bankruptcy, there just might not be a NOD.
So, back to the visual aid here, if you look at the middle of next June, we could be looking at about 23,000 foreclosures. This years total will probably be less than 8,000, but if we "trust" the graph, we are going to be in pain in June of next year.
The real issue here is, if the data assumptions are correct for June of 2007, this implies a banking crisis far greater than the Savings & Loan debacle of the 1990's.